[New Post] Flippity Flip, Bottle Flip! Volume, rates, equations. https://t.co/FQ2QyFJ8Rf #mtbos #bottleflipping pic.twitter.com/tyMtBtyCX8— Jon Orr (@MrOrr_geek) October 7, 2016
There is an excellent Desmos activity that goes along with it. This year I copied and edited my first Desmos activity which was this one.
https://teacher.desmos.com/activitybuilder/custom/57f788035db373e705868c8b
I added two slides:


I wanted to emphasize direct variation and ask them deep meanings of graphs. One of the questions I asked was looking at the graph on the bottom, what inferences can you draw?
On September 8, there was the NATM (Nebraska Association of Teachers of Mathematics) Conference. During Lenny VerMass presentation, Smoke and you Croak or Huffing and Puffing to Understand Slope, he had a very interesting task.
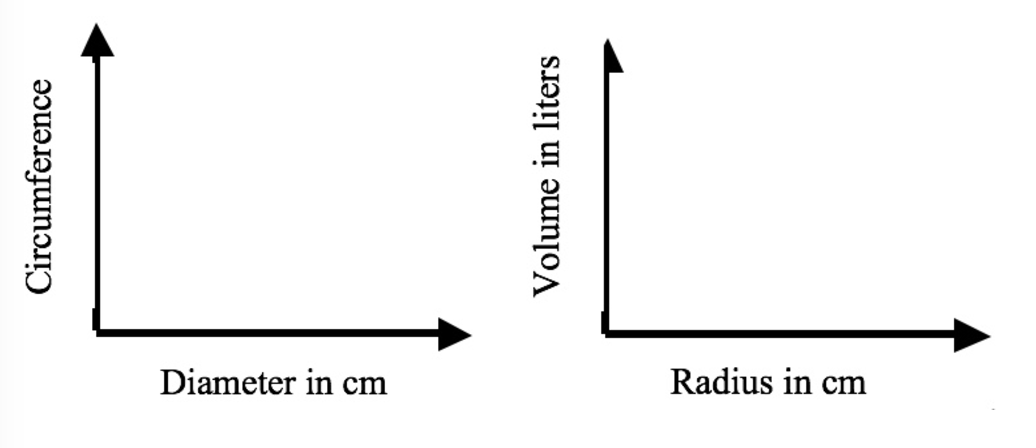
Students had to measure how much air filled their lungs. So we exhaled into a balloon and measured (3) breaths and the circumference of the balloon. Then on a big sheet of paper we had to plot all of our data points for the following graphs and interesting things happened. Try it with your students.
No comments:
Post a Comment